The Dashboard Design Trap
Why showing everything makes dashboards worse.
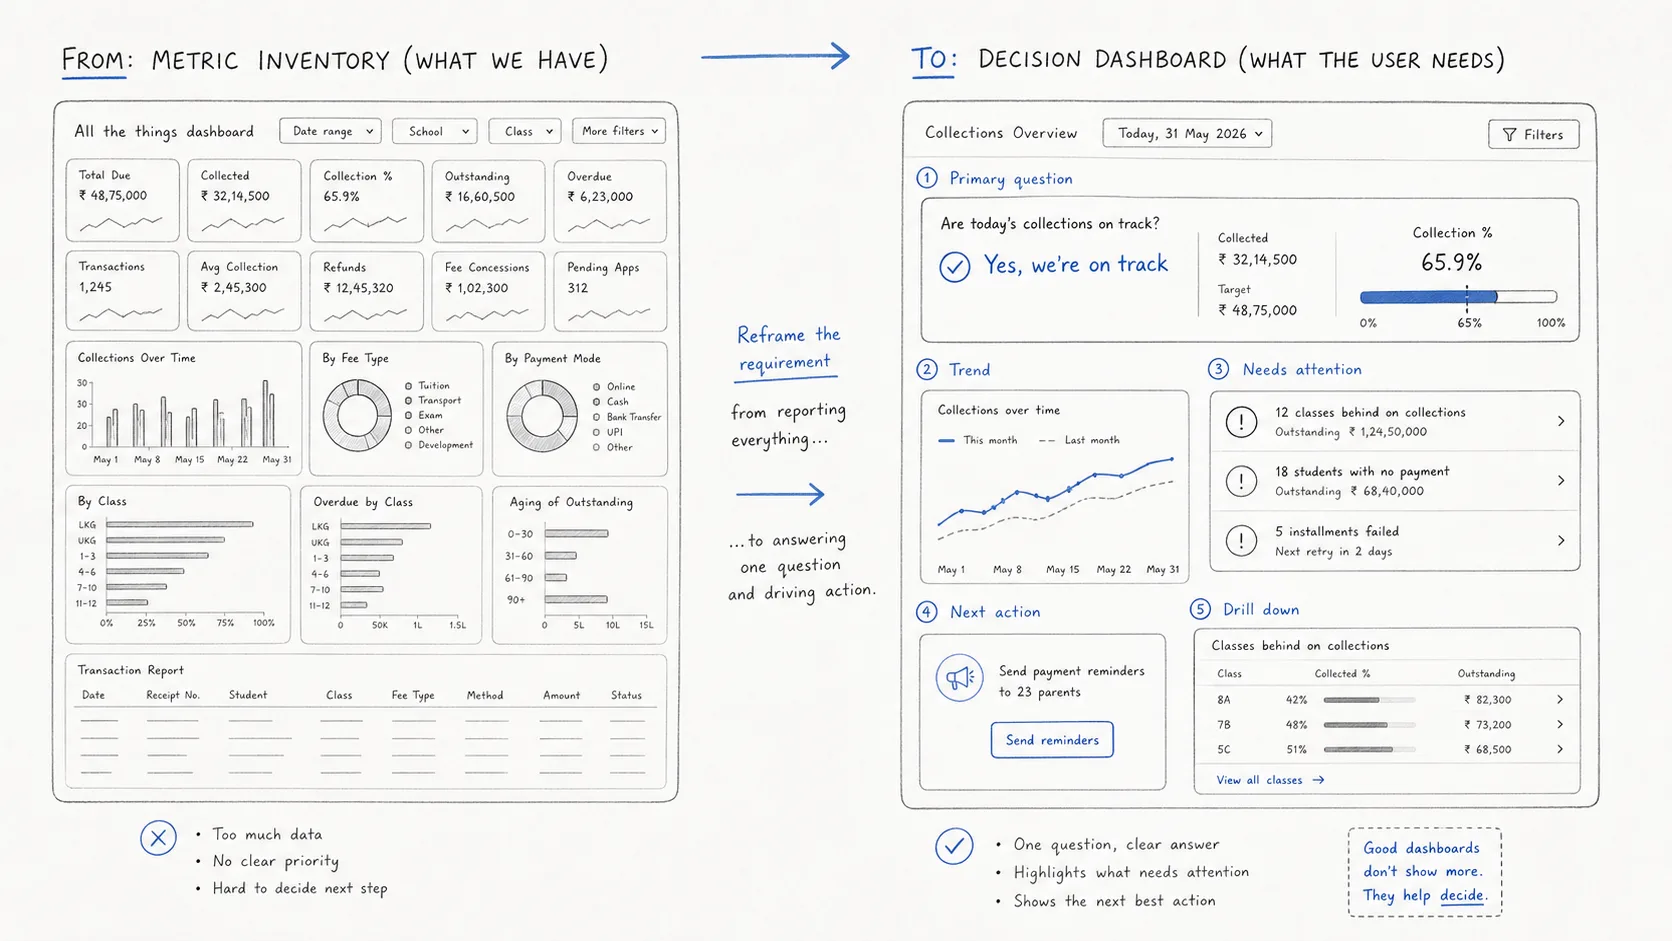
Bad dashboards usually do not fail because they lack data. They fail because they show too much data at the same weight. A dashboard should answer one operational question quickly, then help users drill deeper.
01
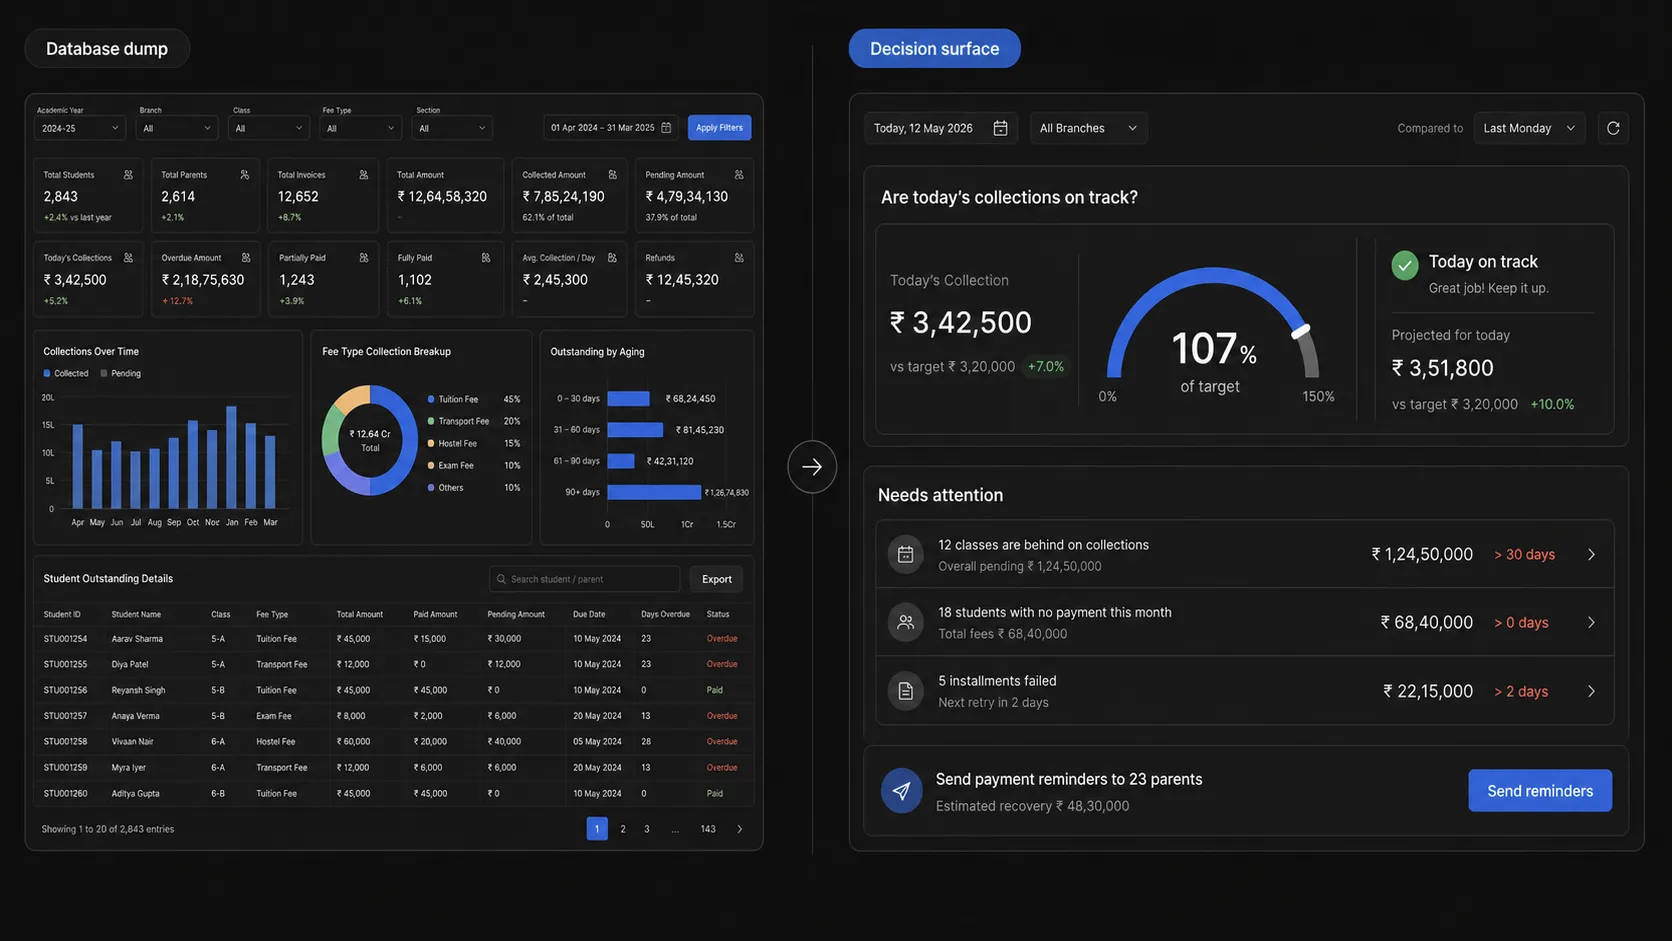
The database dump failure mode
Enterprise dashboards drift toward database dumps. Every metric that exists somewhere in the system eventually earns a card, chart, table, or filter.
Each addition makes sense in isolation. Together, they create a screen that contains answers to many possible questions but answers none of them quickly.
The design job is not to display everything the system knows. It is to turn data into information for the question the user has right now.
02
The 10-second question
A good dashboard has a primary question. For a school finance admin, it might be: are today’s collections on track?
Everything on the first screen should either answer that question or support the next action after that answer. If the user needs more than a few seconds to orient, the dashboard has already become work.
The primary question is found through workflow observation, not stakeholder preference. Watch what users check first, what they calculate manually, and what they ask support to confirm.
03
Tables are rarely the dashboard answer
Tables are excellent for reports because they support detailed comparison. Dashboards usually need faster pattern recognition: trends, outliers, progress, and relative magnitude.
A seven-day table asks users to read and calculate. A sparkline gives the shape of the week immediately.
If the most important number is buried in row three, it is not being treated as important.
04
Data-ink ratio applies to products too
Every border, gridline, icon, label, and color should earn its place. Decoration that does not carry meaning becomes noise the user has to filter.
A dashboard can feel overwhelming with only a few metrics if the visual system is noisy. It can feel calm with many metrics if the hierarchy is disciplined.
The test is blunt: if removing an element does not make the dashboard less useful, remove it.
05
Context turns numbers into decisions
A number without context is a data point. A number compared to target, last week, average, or best day becomes information.
The context does not need to be elaborate. A percentage change, trend line, and plain-language status often do more than another table.
The goal is for users to know what to do next without leaving the dashboard to build their own interpretation.